How to Build Corva Frontend Apps with Highcharts - Complete Guide
What You'll Build
In this guide, you'll learn how to build Corva frontend applications with Highcharts integration for powerful data visualization. You'll create a real-time drilling data visualization app that displays WITS (Wellsite Information Transfer Specification) data using interactive Highcharts. The app will show drilling parameters like hole depth updated in real-time, demonstrating the complete workflow of building Corva FE apps with advanced charting capabilities.
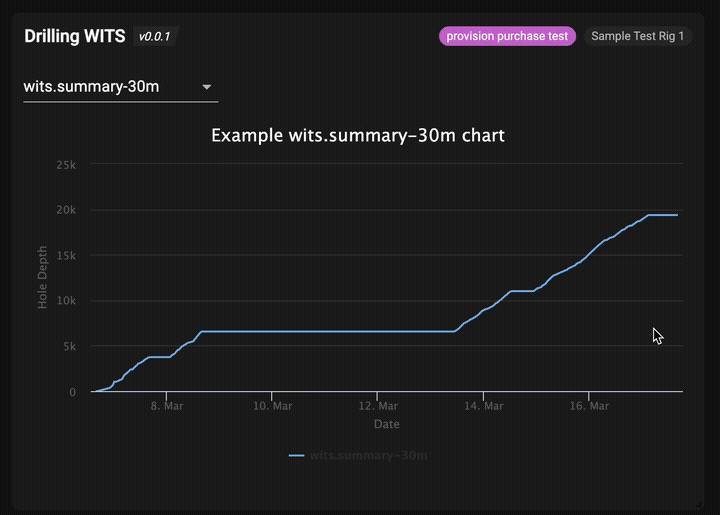
The completed drilling WITS app showing real-time data visualization
Key Features You'll Implement:
- ✅ Real-time drilling data visualization
- ✅ Interactive Highcharts integration
- ✅ Multiple time interval selection (6h, 30m, 1m, 1ft)
- ✅ Responsive modern UI using Corva Design System
- ✅ Live data streaming via Corva SDK
Prerequisites
System Requirements
- Node.js: Version 24 or higher (required for @corva/ui 3.62.0)
- Yarn: Package manager
- Git: Version control
- Corva Account: Access to Corva platform
Verify Your Environment
# Check Node version (should be 24+)
node --version

# Check if yarn is installed
yarn --version

# Install yarn if needed
npm install -g yarn
If you need Node 24, use nvm:
# Install nvm if needed
curl -o- https://raw.githubusercontent.com/nvm-sh/nvm/v0.39.0/install.sh | bash

# Install and use Node 24
nvm install 24
nvm use 24
Step 1: Generate the Base App Using Corva CLI
Create your new drilling WITS app using the Corva CLI:
npx @corva/create-app drilling-wits-app \
  --appName "Drilling WITS Dashboard" \
  --segments "drilling" \
  --category "analytics" \
  --appKey "your-company.drilling_wits_dashboard.ui" \
  --appType "ui" \
  --runtime "ui"
This command creates a basic React app structure with these files:
# Navigate to your new app
cd drilling-wits-app

# Install dependencies
yarn install
Step 2: Understanding the Generated App Structure
After generation, your project structure looks like this:
drilling-wits-app/
├── src/
│   ├── App.js              # Basic component showing rig/well info
│   ├── AppSettings.js      # Simple settings with checkbox
│   ├── constants.js        # Basic default settings
│   ├── index.js           # App entry point
│   ├── App.css            # Basic styling
│   └── assets/            # Static assets (logo, etc.)
├── config-overrides.js    # Webpack configuration
├── package.json          # Dependencies and scripts
├── manifest.json         # Corva app manifest
├── .nvmrc                # Node version specification
├── .eslintrc             # ESLint configuration
└── README.md            # Project documentation
Generated Files Explained:
src/App.js - Basic component that displays rig and well information:
// Generated basic App.js
function App({ isExampleCheckboxChecked, rig, well }) {
  return (
    <AppContainer header={<AppHeader />}>
      <div>
        <img src={logo} alt="logo" />
        <p>Rig: {rig.name}</p>
        <p>Well: {well.name}</p>
        <p>Settings checkbox is {isExampleCheckboxChecked ? 'checked' : 'unchecked'}</p>
      </div>
    </AppContainer>
  );
}
src/AppSettings.js - Simple settings component with one checkbox:
// Generated basic AppSettings.js
function AppSettings({ settings, onSettingChange }) {
  return (
    <div>
      <FormControlLabel
        label="Example checkbox"
        control={
          <Checkbox
            checked={settings.isExampleCheckboxChecked}
            onChange={e => onSettingChange('isExampleCheckboxChecked', e.target.checked)}
          />
        }
      />
    </div>
  );
}
src/constants.js - Basic default settings:
// Generated basic constants.js
export const DEFAULT_SETTINGS = {
  isExampleCheckboxChecked: false,
};
Step 3: Install Additional Dependencies for WITS Visualization
Add the required packages for data visualization and real-time functionality:
yarn add highcharts highcharts-react-official lodash prop-types
Important: Currently, the maximum supported Highcharts version is 8.1.2. Support for higher versions will be added in future releases.
Update your package.json to match our target configuration:
{
  "name": "DrillingWITS",
  "version": "0.0.1",
  "main": "src/index.js",
  "scripts": {
    "build": "webpack --config=./config-overrides.js --mode production",
    "start": "webpack-dev-server --config=./config-overrides.js --open --mode development",
    "zip": "create-corva-app --zip ui",
    "lint": "eslint --cache ./src/"
  },
  "dependencies": {
    "@corva/ui": "^3.12.0",
    "@material-ui/core": "4.11.2",
    "@material-ui/icons": "4.9.1",
    "@material-ui/lab": "4.0.0-alpha.57",
    "@material-ui/pickers": "3.2.10",
    "classnames": "2.2.6",
    "corva-convert-units": "1.10.33",
    "highcharts": "8.1.2",
    "highcharts-react-official": "2.2.2",
    "lodash": "^4.17.21",
    "mapbox.js": "3.2.1",
    "moment": "2.29.4",
    "moment-timezone": "0.5.43",
    "prop-types": "^15.6.1",
    "react": "17.0.1",
    "react-dom": "17.0.1"
  },
  "devDependencies": {
    "postcss-loader": "4.2.0",
    "webpack": "5.94.0",
    "webpack-dev-server": "4.15.2",
    "webpack-cli": "5.1.4",
    "@corva/dc-platform-shared": "latest",
    "babel-loader": "8.1.0",
    "@babel/core": "^7.12.10",
    "@babel/preset-env": "^7.12.11",
    "@babel/preset-react": "^7.12.10",
    "postcss": "8.4.31"
  }
}
Step 4: Transform Constants for WITS Data
Replace the basic constants with WITS-specific dataset definitions:
Replace src/constants.js:
export const DATASETS = [
  'wits.summary-6h',
  'wits.summary-30m',
  'wits.summary-1m',
  'wits.summary-1ft',
];
These represent different time intervals for WITS data aggregation, allowing users to view drilling data at various granularities.
Step 5: Create the Data Fetching Hook
Create a new directory structure and build a custom React hook for WITS data management:
Create directory: src/effects/
Create src/effects/useWITSSummaryData.js:
import { useState, useEffect } from 'react';
import { corvaDataAPI, socketClient } from '@corva/ui/clients';
import { reverse } from 'lodash';

async function fetchWITSSummaryData({ assetId, dataset }) {
  try {
    return await corvaDataAPI.get(`/api/v1/data/corva/${dataset}/`, {
      limit: 1000,
      skip: 0, // NOTE: Required for pagination
      // NOTE: Make sure the sort field hit database indexes. Otherwise the request will take too long
      sort: JSON.stringify({ timestamp: -1 }),
      query: JSON.stringify({ asset_id: assetId }),
      // NOTE: To make efficient request - fetch only fields used by the app
      fields: ['timestamp', 'data.hole_depth', 'data.state'].join(','),
    });
  } catch (e) {
    console.log(e);
    return [];
  }
}

function useWITSSummaryData({ assetId, dataset }) {
  // NOTE: Define state to store subscription data
  const [witsSummaryData, setWITSSummaryData] = useState([]);

  const [loading, setLoading] = useState(false);

  useEffect(() => {
    let unsubscribe;
    setLoading(true);

    // Make initial request first
    fetchWITSSummaryData({ assetId, dataset })
      .then(response => {
        setWITSSummaryData(reverse(response));

        const subscription = { provider: 'corva', dataset, assetId }; // Subscription params
        // Concatenate new records to state
        const onDataReceive = event => setWITSSummaryData(prevData => prevData.concat(event.data));

        // NOTE: Subscribe to updates after initial data request
        unsubscribe = socketClient.subscribe(subscription, { onDataReceive });
      })
      .finally(() => setLoading(false));

    // NOTE: Unsubscribe to prevent memory leaks and crashes in your app.
    return () => unsubscribe?.();
  }, [assetId, dataset]);

  return { loading, witsSummaryData };
}

export default useWITSSummaryData;
Create src/effects/index.js:
export { default as useWITSSummaryData } from './useWITSSummaryData';
How This Hook Works:
- Initial HTTP Request: Fetches the last 1000 WITS records for the selected dataset
- WebSocket Subscription: Establishes real-time connection for live updates
- State Management: Manages loading states and data updates
- Memory Management: Properly cleans up subscriptions to prevent leaks
Step 6: Build the Chart Component System
Create the Highcharts integration components:
Create directory: src/components/WITSSummaryChart/
Create src/components/WITSSummaryChart/options.js:
const defaultHighchartsOptions = {
  chart: {
    backgroundColor: '#201f1f',
    type: 'line',
  },
  plotOptions: {
    series: {
      marker: {
        enabled: false,
      },
    },
  },
  xAxis: {
    type: 'datetime',
    title: { text: 'Date' },
  },
  yAxis: {
    title: { text: 'Hole Depth' },
    gridLineColor: '#3b3b3b',
    min: 0,
  },
  credits: { enabled: false },
  exporting: { enabled: false },
};

export function getHighchartsOptions({ data, dataset }) {
  const series = [
    {
      name: dataset,
      data: data.map(witsRecord => ({
        x: witsRecord.timestamp * 1000,
        y: witsRecord.data.hole_depth,
        name: witsRecord.data.state,
      })),
      turboThreshold: 20000,
    },
  ];

  return {
    ...defaultHighchartsOptions,
    title: { text: `Example ${dataset} chart`, style: { color: 'white' } },
    series,
  };
}
Create src/components/WITSSummaryChart/index.js:
import { useMemo, useRef, useEffect } from 'react';
import Highcharts from 'highcharts';
import HighchartsReact from 'highcharts-react-official';

import { getHighchartsOptions } from './options';
import styles from './styles.css';

function WITSSummaryChart({ data, dataset, coordinates }) {
  const chartRef = useRef();

  useEffect(() => {
    // NOTE: Update chart size when container size has changed
    chartRef.current?.chart.setSize();
  }, [coordinates]);

  // NOTE: Use memoization technique
  // Calculate chart options ONLY when data changed.
  // This will also help avoid choppy animation
  return useMemo(() => {
    const options = getHighchartsOptions({ data, dataset });

    return (
      <HighchartsReact
        highcharts={Highcharts}
        options={options}
        // NOTE: Pass className to style highchart
        containerProps={{ className: styles.chartContainer }}
        ref={chartRef}
      />
    );
  }, [data]);
}

export default WITSSummaryChart;
Create src/components/WITSSummaryChart/styles.css:
.chartContainer {
  height: 400px;
  width: 100%;
  margin: 20px 0;
}
Create src/components/index.js:
export { default as WITSSummaryChart } from './WITSSummaryChart';
Step 7: Transform the Main App Component
Replace the basic generated App.js with our sophisticated drilling visualization interface:
Replace src/App.js:
/*
    This example is a simple app which consists of: AppHeader, Select and Highcharts Chart
*/
import { useState } from 'react';
import { LoadingIndicator, AppHeader, Select } from '@corva/ui/components';
import { MenuItem } from '@material-ui/core';

import { useWITSSummaryData } from './effects';
import { WITSSummaryChart } from './components';
import { DATASETS } from './constants';

import styles from './styles.css';

function App(props) {
  // NOTE: Read asset_id from well. Most datasets are indexed by asset_id.
  const {
    well: { asset_id: assetId },
    coordinates,
    appHeaderProps,
  } = props;

  const [dataset, setDataset] = useState(DATASETS[0]);
  // NOTE: Use custom react hook to encapsulate data fetching/subscriptions logic
  const { witsSummaryData, loading } = useWITSSummaryData({ assetId, dataset });

  return (
    <div className={styles.container}>
      <AppHeader {...appHeaderProps} />

      <div className={styles.content}>
        <Select
          value={dataset}
          onChange={e => setDataset(e.target.value)}
          FormControlProps={{ className: styles.select }}
        >
          {DATASETS.map(dataset => (
            <MenuItem key={dataset} value={dataset}>
              {dataset}
            </MenuItem>
          ))}
        </Select>

        {/*Show loading indicator while data is loading*/}
        {loading && <LoadingIndicator />}
        {!loading && (
          <WITSSummaryChart data={witsSummaryData} coordinates={coordinates} dataset={dataset} />
        )}
      </div>
    </div>
  );
}

// Important: Do not change root component default export (App.js). Use it as container
//  for your App. It's required to make build and zip scripts work as expected;
export default App;
Key Transformations Made:
- Removed basic rig/well display → Added sophisticated data visualization
- Added dataset selection → Dropdown for choosing time intervals
- Integrated custom hook → Real-time data fetching and management
- Added chart component → Highcharts visualization
- Enhanced layout → Professional container and content structure
Step 8: Add Professional Styling
Create new styling to replace the basic generated styles:
Create src/styles.css:
.container {
  display: flex;
  flex-direction: column;
  height: 100%;
  background-color: #1a1a1a;
}

.content {
  flex: 1;
  padding: 20px;
  overflow: auto;
}

.select {
  margin-bottom: 20px;
  min-width: 200px;
}
Update src/App.css:
.App {
  text-align: center;
  background-color: #1a1a1a;
  color: white;
  min-height: 100vh;
}

.App-header {
  background-color: #282c34;
  padding: 20px;
  color: white;
}

.App-link {
  color: #61dafb;
}

/* Additional styling for drilling app */
.drilling-container {
  padding: 20px;
  max-width: 1200px;
  margin: 0 auto;
}

.dataset-selector {
  margin-bottom: 20px;
  display: flex;
  align-items: center;
  gap: 10px;
}

.chart-wrapper {
  background-color: #2a2a2a;
  border-radius: 8px;
  padding: 20px;
  margin-top: 20px;
}
Step 9: Update App Settings
Transform the basic settings to work with our drilling app:
Replace src/AppSettings.js:
import { Checkbox, FormControlLabel } from '@material-ui/core';
import PropTypes from 'prop-types';

import { DATASETS } from './constants';

function AppSettings({
  settings: apiSettings,
  onSettingChange,
  // appData,
  // app,
  // user,
  // company,
}) {
  const settings = { ...DATASETS, ...apiSettings };
  return (
    <div>
      <FormControlLabel
        label="Example checkbox"
        control={
          <Checkbox
            checked={settings.isExampleCheckboxChecked}
            onChange={e => onSettingChange('isExampleCheckboxChecked', e.target.checked)}
          />
        }
      />
    </div>
  );
}

AppSettings.propTypes = {
  app: PropTypes.shape({}).isRequired,
  appData: PropTypes.shape({}).isRequired,
  company: PropTypes.shape({}),
  onSettingChange: PropTypes.func.isRequired,
  settings: PropTypes.shape({
    isExampleCheckboxChecked: PropTypes.bool
  }).isRequired,
  user: PropTypes.shape({}),
};

AppSettings.defaultProps = {
  user: {},
  company: {},
};

// Important: Do not change root component default export (AppSettings.js). Use it as container
//  for your App Settings. It's required to make build and zip scripts work as expected;
export default AppSettings;
Step 10: Test Your Transformed Application
Start the development server to see your transformation:
yarn start
What You Should See:
- Dataset Selection: Dropdown with WITS time intervals (6h, 30m, 1m, 1ft)
- Loading States: Professional loading indicators during data fetch
- Real-time Chart: Highcharts visualization showing hole depth over time
- Responsive Design: Chart adjusts to window size changes
Testing Your App:
- Dataset Selection: Switch between different time intervals
- Loading States: Verify loading indicators appear during data fetch
- Real-time Updates: Check browser console for WebSocket connections
- Chart Visualization: Confirm hole depth data displays correctly
- Responsive Design: Resize browser window to test chart responsiveness
Debugging:
- Console Logs: Check for API call logs and WebSocket connection status
- Network Tab: Monitor HTTP requests to
/api/v1/data/corva/{dataset}/ - Data Verification: Ensure asset_id is being extracted from well context
Step 11: Understanding the Complete Data Flow
How Everything Works Together:
App Initialization:
- Component mounts and extracts
asset_idfrom well props - Sets initial dataset to first option (6h)
- Component mounts and extracts
Data Fetching Hook Activation:
useWITSSummaryDatahook triggers with asset ID and dataset- Makes HTTP request to
/api/v1/data/corva/wits.summary-6h/ - Fetches last 1000 records with optimized field selection
Initial Data Processing:
- Response data is reversed (oldest first for time series)
- Loading state is set to false
- Chart component receives data
WebSocket Subscription:
- Real-time subscription established for live updates
- New data automatically appends to existing dataset
- Chart updates in real-time
Chart Rendering:
- Highcharts transforms WITS data into time series format
- Displays hole depth over time with professional styling
- Memoization prevents unnecessary re-renders
User Interactions:
- Dataset selection triggers new API calls
- Loading states provide user feedback
- Chart updates with new time interval data
API Endpoints Used:
- HTTP:
/api/v1/data/corva/wits.summary-{interval}/for initial data - WebSocket: Real-time subscription for live drilling data updates
Data Structure:
// WITS record structure
{
  timestamp: 1640995200,
  asset_id: "drilling-rig-123",
  data: {
    hole_depth: 1250.5,
    state: "drilling"
  }
}
Step 12: Build and Deploy
Create Production Build:
yarn build
Package for Deployment:
yarn zip
Deploy to Corva Platform:
yarn release
Your complete drilling WITS visualization app will be available in the Corva platform's drilling segment.
Step 13: Summary of Transformation
What We Changed:
From Basic Generated App:
- Simple rig/well display
- Basic checkbox setting
- Static content
- Minimal styling
To Sophisticated WITS App:
- Real-time data visualization
- Multiple dataset selection
- Custom React hooks for data management
- Highcharts integration
- Professional UI with loading states
- WebSocket subscriptions for live updates
Files Added/Modified:
New Files:
src/effects/useWITSSummaryData.js- Custom data hooksrc/effects/index.js- Effects exportsrc/components/WITSSummaryChart/index.js- Chart componentsrc/components/WITSSummaryChart/options.js- Chart configurationsrc/components/WITSSummaryChart/styles.css- Chart stylingsrc/components/index.js- Components exportsrc/styles.css- App styling
Modified Files:
src/App.js- Complete transformation to data visualizationsrc/constants.js- WITS datasets instead of basic settingssrc/AppSettings.js- Updated with PropTypessrc/App.css- Enhanced stylingpackage.json- Added visualization dependencies
This transformation demonstrates how to evolve a basic Corva app into a sophisticated, production-ready drilling data visualization application with real-time capabilities.